
While global positioning has long been solved by GPS and similar systems, these technologies have a clear limitation—they only work outdoors. This is because GNSS receivers require continuous visibility of GNSS signals, which isn’t possible indoors. Until recently, affordable and reliable indoor positioning remained an unsolved challenge, with previous technologies being either too expensive or unreliable.
However, the introduction of Bluetooth 5.1’s AoA (Angle of Arrival) direction-finding technology marked a breakthrough. U-Blox, a Swiss specialist in positioning solutions, leveraged this technology to develop a series of products for indoor positioning within its short-range portfolio. The first announcement of an AoA antenna capable of providing ready-to-use azimuth and elevation angles dates back to around 2021. Since then, I’ve had a hardware and software integration test on my to-do list. So, here it is—a long-overdue demo.
Demonstration goals :
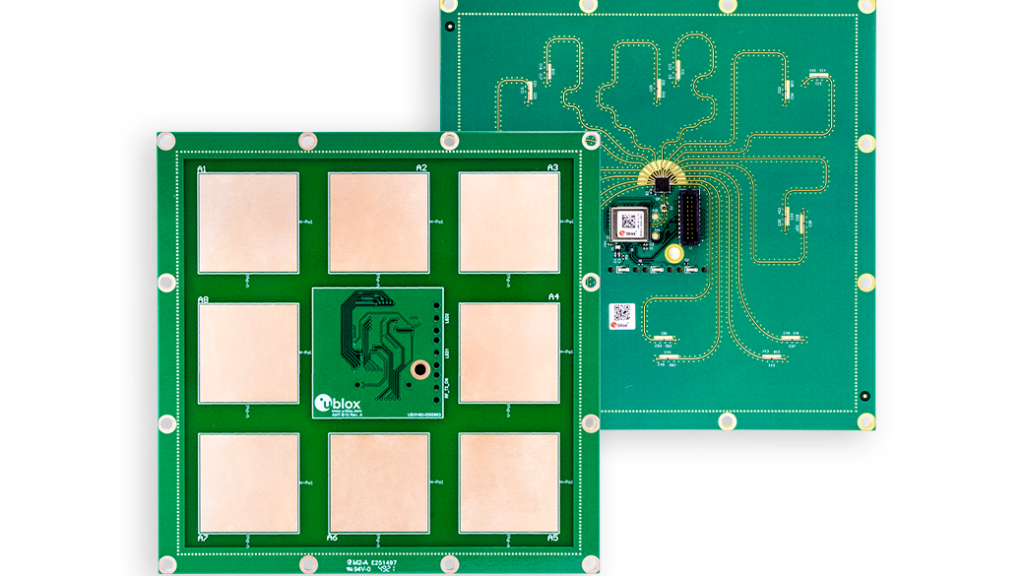
U-Blox has already done much of the heavy lifting by providing the ANT-B10 antenna, which runs the u-Locate firmware. This product is specifically designed to handle the complex physics behind AoA calculations, delivering azimuth and elevation angles directly. The main goal of this demo is to create a functional setup around this antenna with minimal integration effort. The specific objectives are:
- Design simple hardware to enable the ANT-B10 to broadcast the calculated angles.
- Develop minimalistic software to collect angle measurements from different anchors and output the coordinates in a three-dimensional Cartesian coordinate system.
- Ensure the system operates wirelessly.
- Evaluate the performance of U-Blox’s positioning solution in generic indoor environment—in this case, a small office space—considering installation constraints similar to those an IT technician or electrical maintenance professional might encounter during real-world installations.
Note : Only static accuracy measurement are covered in this article.
A-System architecture
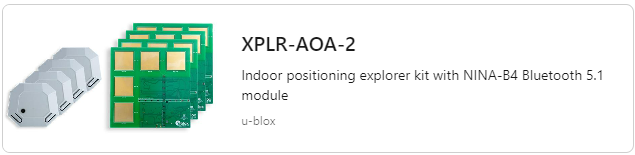
The system is based on Ublox ANT-B10 and C209 AoA-Tag
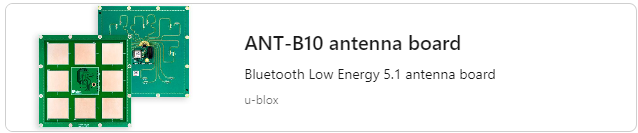
Both product available from Ublox as part of evaluation kit XPLR-AOA-2
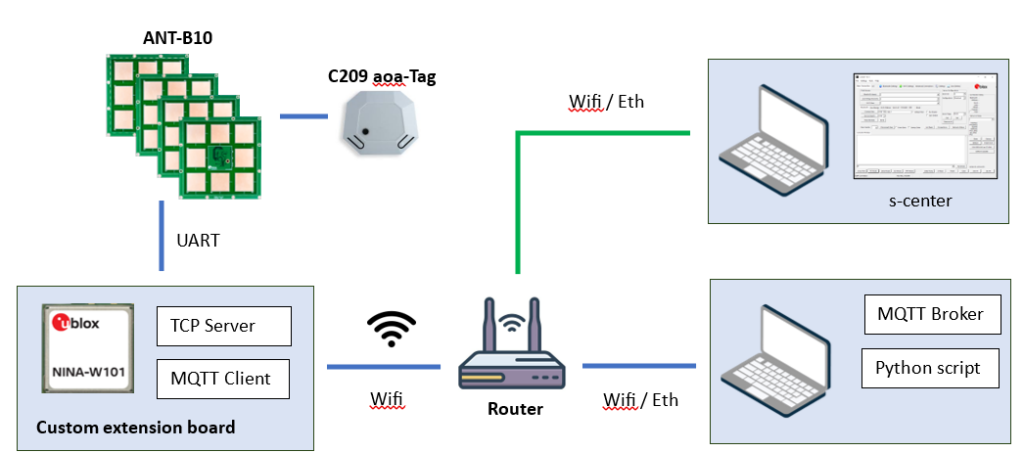
I will be using four ANT-B10 anchors and a single C209 tag for tracking. Each anchor is connected to a custom-designed extension board via UART, which allows it to transmit calculated angles over Wi-Fi. The extension board can function as a transparent TCP server, enabling the ANT-B10 to communicate directly with the Ublox evaluation tool for short-range products, S-Center, using AT commands. S-Center provides a dedicated interface for AoA (Angle of Arrival) evaluation, as shown below, and supports TCP client mode for connecting to devices, in addition to the standard serial UART connectivity commonly used in all Ublox short-range products.
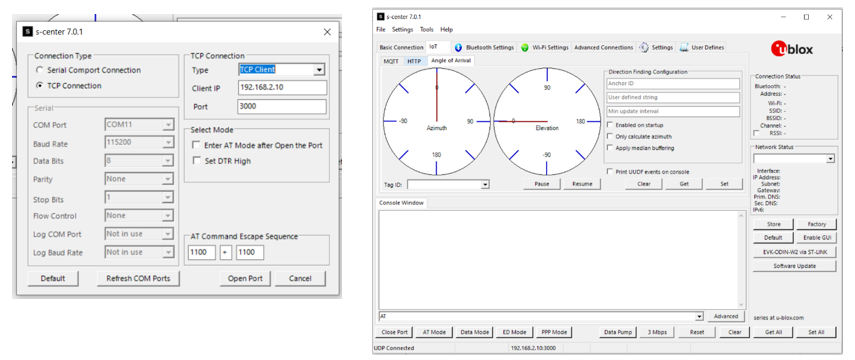
TCP server mode will be used only for debugging purposes. For the main operation, the extension board will function as an MQTT client, publishing data received from the ANT-B10 to an MQTT broker hosted on a Linux machine via Wi-Fi.
B-Extension board design
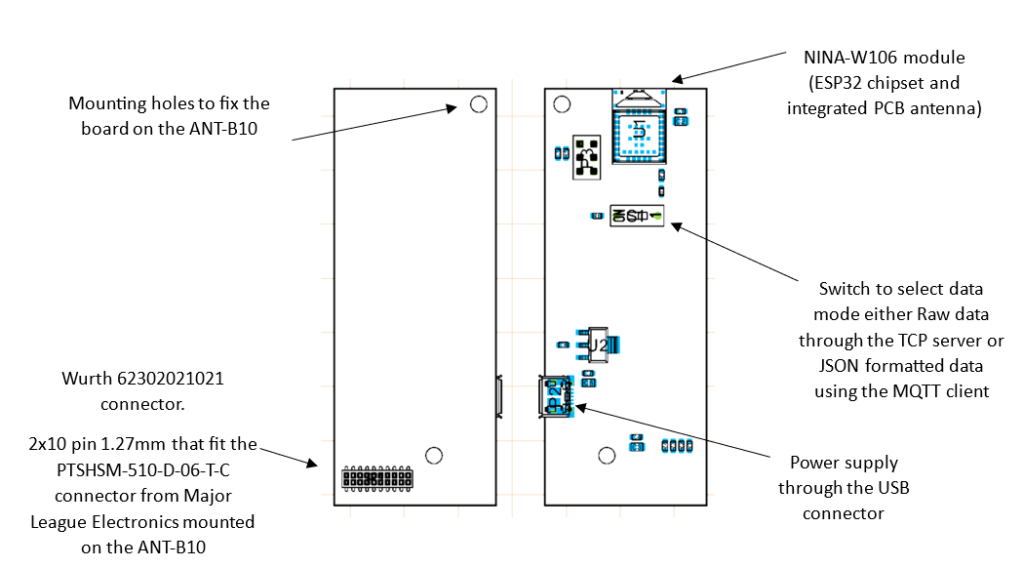
The ANT-B10 itself does not offer any connectivity beyond the UART interface. Communication with the board for configuration or receiving AoA data is handled through a set of AT commands and URCs (Unsolicited messages that the ANT-B10 sends when it detects the tag’s broadcast). This allows the integrator to adapt the communication support and format to suit their specific application needs. In our case, the physical layer will be Wi-Fi connectivity, and the protocol will be MQTT. Therefore, we require a simple hardware design that supports both while minimizing firmware development time. U-blox provides the NINA-W10x Wi-Fi Open CPU module, based on the Espressif ESP32 chipset, which is more than sufficient for this purpose.
B.1-Hardware design
This board design is simplistic with a short list of requirements:
- Provide power supply to the ANT-B10 through the 1.27mm connector.
- Communicate with the ANT-B10 through the UART interface, also available on the 1.27mm connector.
- The board will be power from a power bank so an USB port is used as a power source.
- Help mechanically to hold the ANT-B10 on a smartphone tripod.
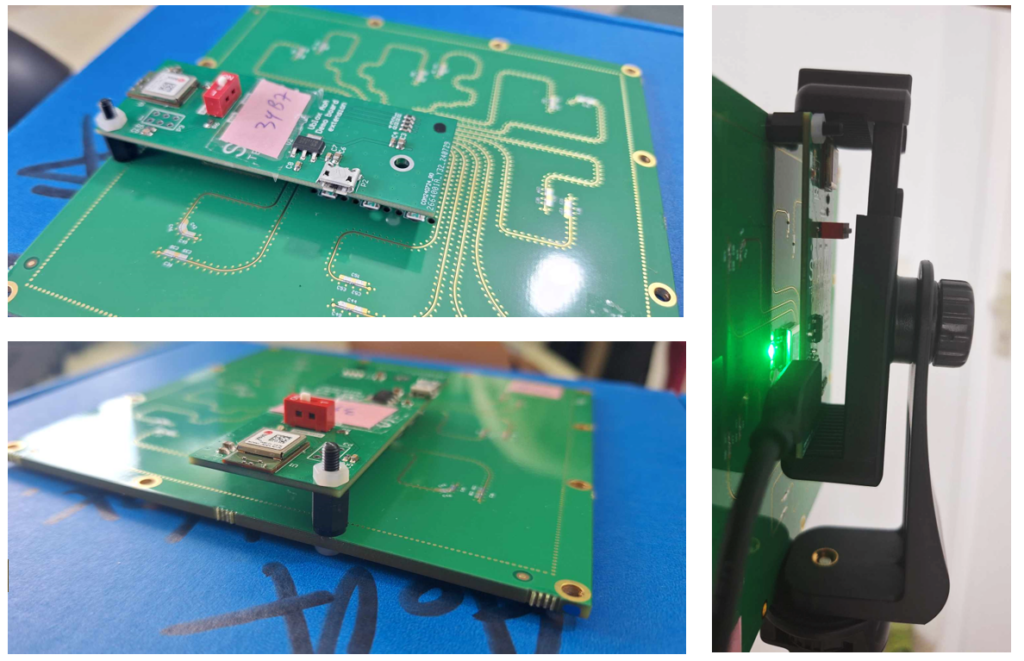
and the end result is this
B.2-Software development
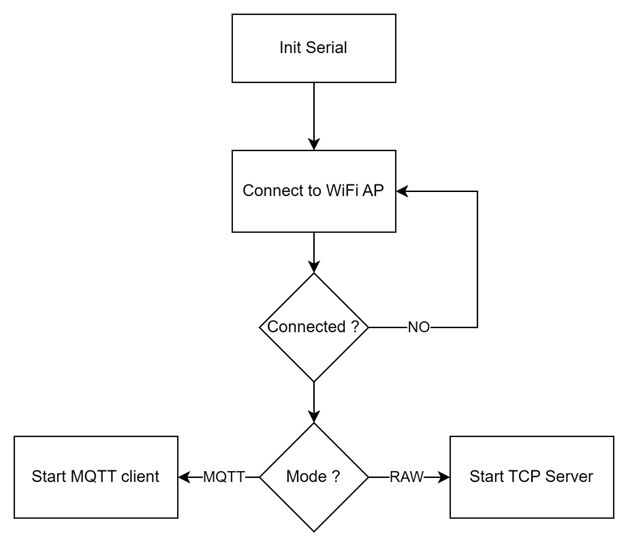
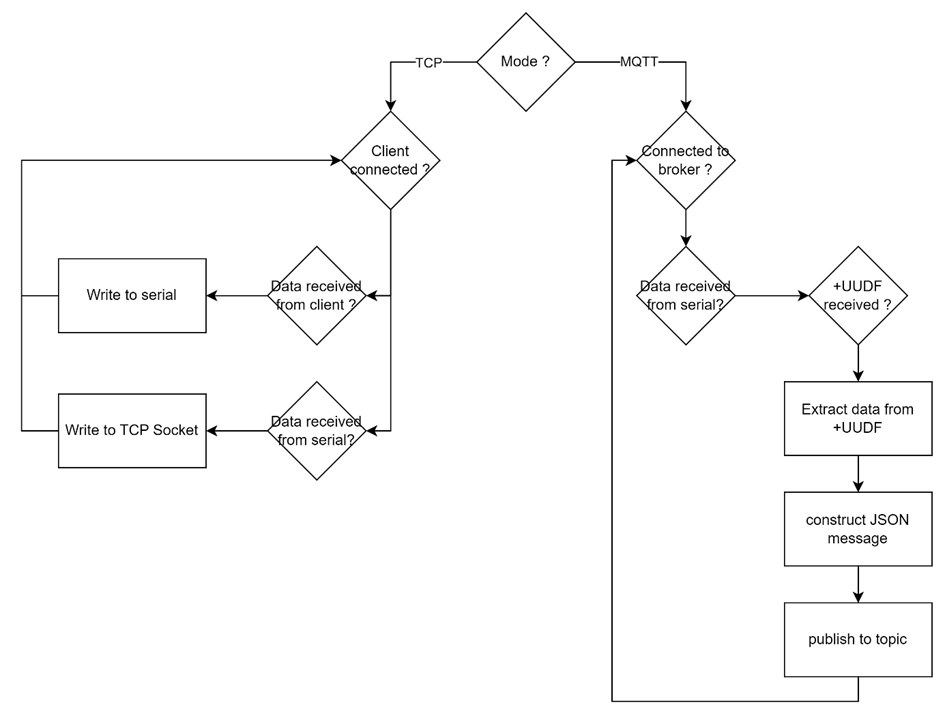
On the software side, one can use the Espressif ESP-IDF framework or the Arduino IDE. For this small, single-task design, we chose the Arduino IDE. The software operates as described below. In raw data mode, the module transmits data received from the serial interface directly to the TCP client and vice versa. In MQTT mode, the software decodes the +UUDF URC, which contains all the necessary data (Anchor ID, Tag ID, Azimuth, and Elevation angles), formats it into a JSON structure, and publishes it.
C-Server setup
In this demo, I will be using an Ubuntu 22.04 installed on a VM and running Mosquitto MQTT Broker. To test the anchors, simply subscribe to the topic using the command $mosquitto_sub -t « topic_name ». Once everything is powerup, we should see a Json structure being published by the anchor with all the data that we need.

C.1-Python script
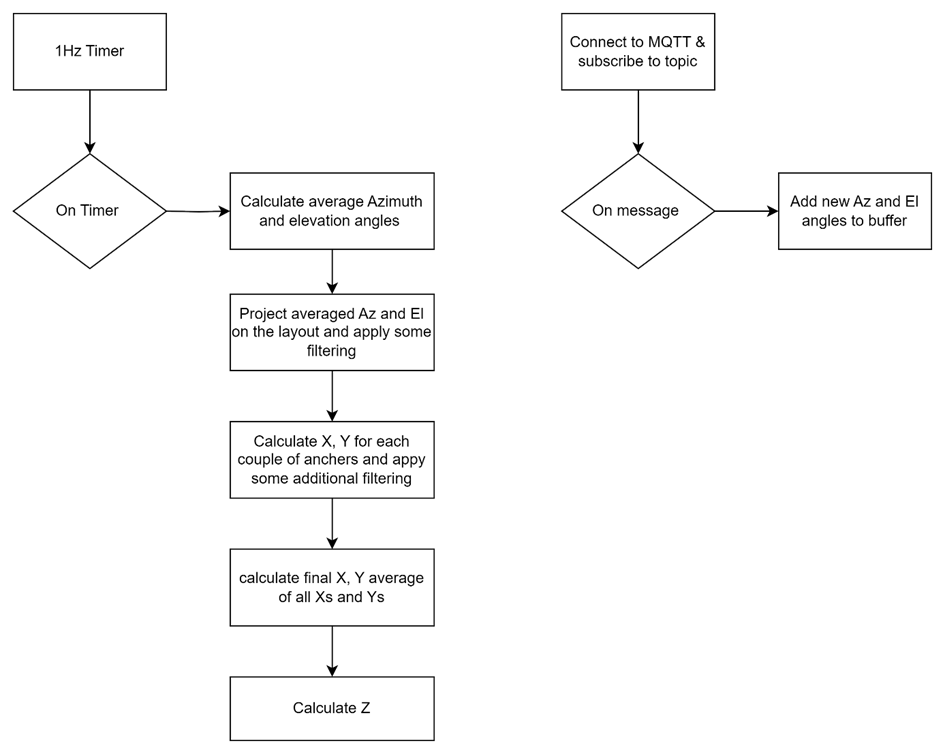
The software that processes data from the four anchors and outputs the coordinates operates based on the following algorithm. The « On message » event is triggered every time the server receive a published message from the anchors, the received data are buffered for each anchor.
The « 1Hz Timer » is an event triggered every second to calculate the coordinates using the buffered data. In addition to some analytic calculation not listed below.
D-Measurements
D.1-Single anchor measurement jitter and effect of the tag orientation
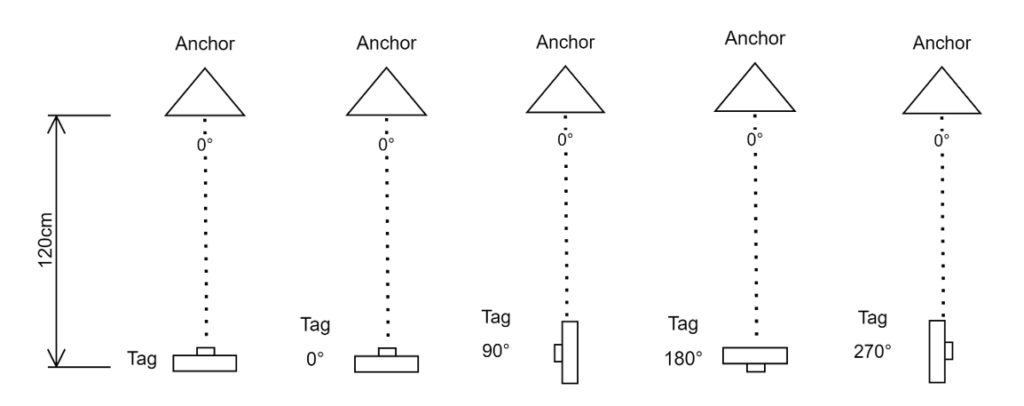
The first test in this series will evaluate the stability of a single angle measurement. The setup involves placing the tag at a fixed distance in front of the antenna for a period of time and recording the measured azimuth angle. I repeated the test with the tag in different orientations, as orientation can impact results with some other indoor positioning technologies.
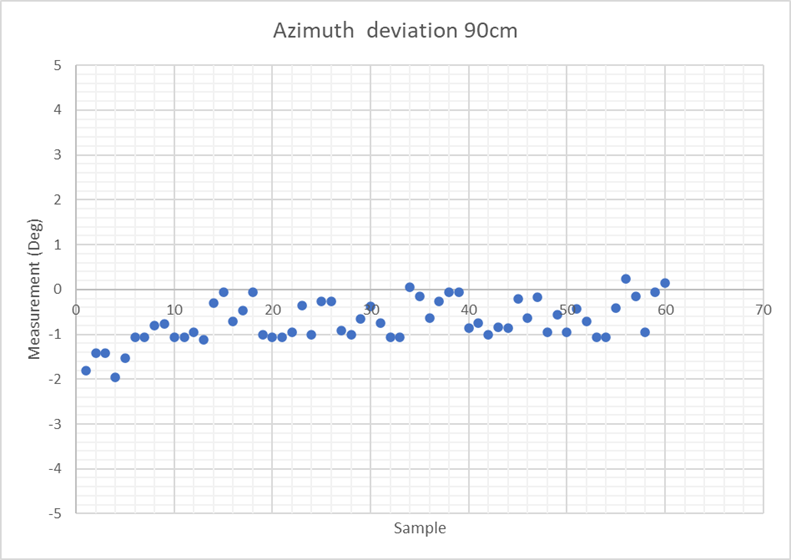
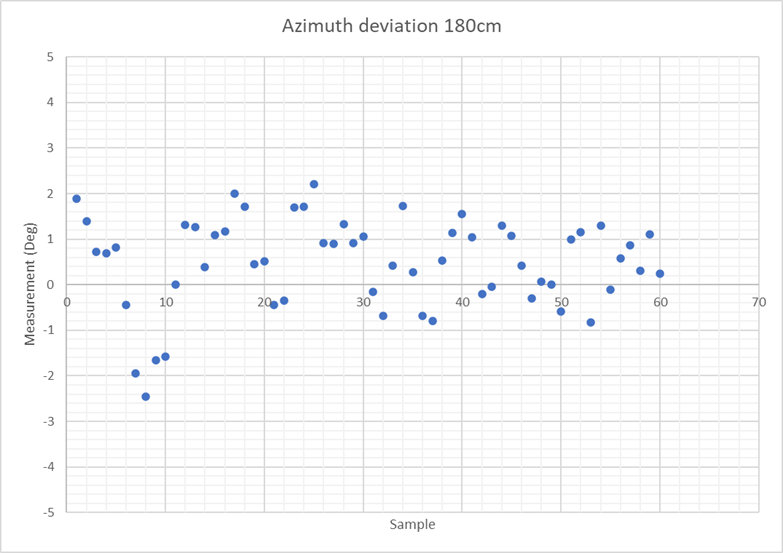
Azimuth angle fluctuation is around 2° 90cm away from anchor and 4° 180cm away.
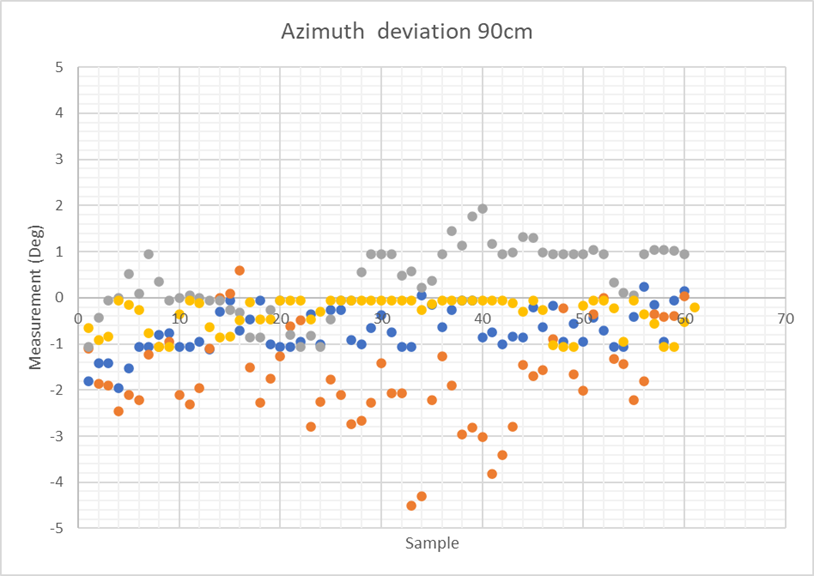
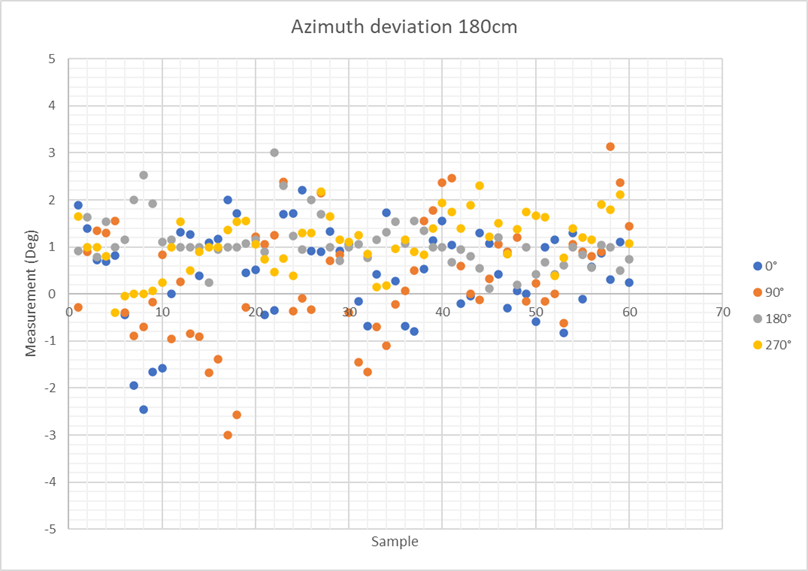
The overall measurement fluctuation is around 6°, the mean shift from the 0° orientation is around 1 or 2°
D.2-Static horizontal position accuracy measurement
D.2.1-Test setup and calculation method
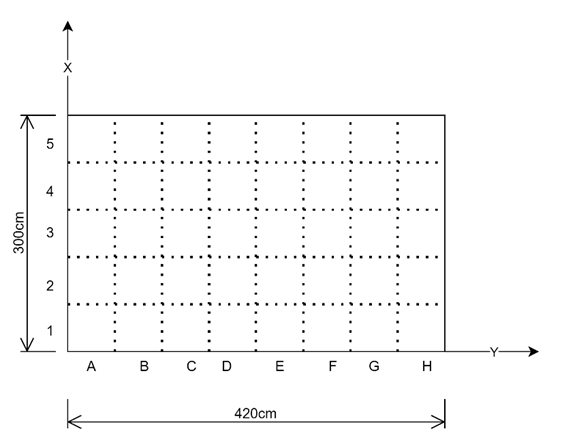
The anchors are placed in the following arrangement and oriented to the center of the test area. The tag is placed in the center of the area and the antennas orientation are adjusted to get 0°.
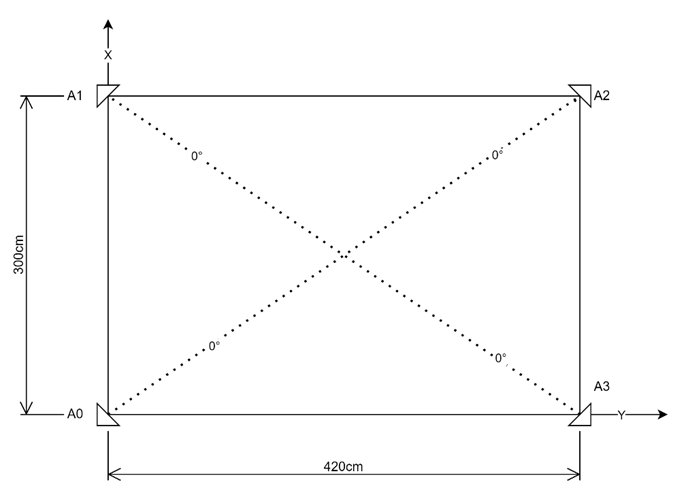
Note that while I chose to do it this way, it was not mandatory.
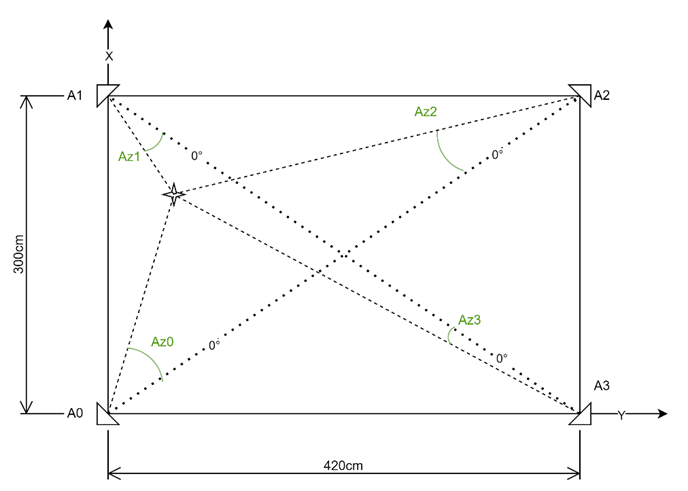
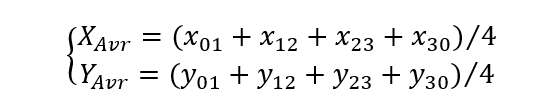
Each anchor will return an azimuth measurement between -90° and 90°. As example, anchor A0 will provide a negative value when moving from the X axis to the Y axis. To simplify the calculations, the angles will be adjusted to reflect the following values and then the X, Y coordinates are calculated by some simple trigonometry.
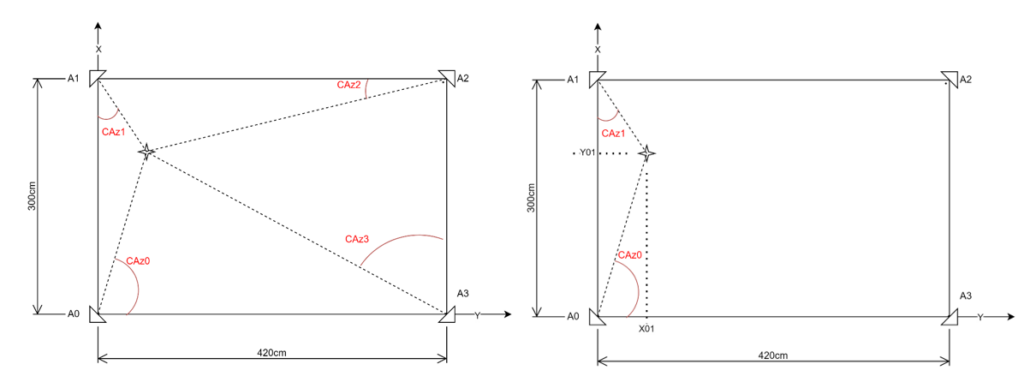
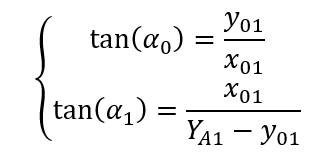
Using the same method on each couple of anchors will give 4 X and Y measurement
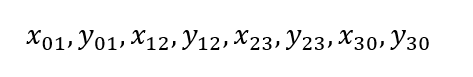
Depending on the real position some will give better measurement than other, so to improve the overall accuracy, the final coordinates will be the average of these values
D.2.2-Measurements method
To evaluate the measurement accuracy of this setup, the test area is divided to 7×5 cells of 60x60cm each. For each measurement the tag is placed in the center of the cell.
The Python script will measure the position for 60 seconds, counting the number of times the measured position falls within the specified cell boundaries. It will also record the maximum distance between the measured position and the reference point—typically the center of the specified cell. This distance serves as a measure of the true error and can be used as an indicator of the system’s accuracy.
For example, if we select cell C2 and the algorithm calculate a position within this cell limits for 50 times it will return a hit-rate of (50*100)/60=83%. If the absolute maximum distance to the center of C2 cell on either X or Y axis is 23cm, then this will be returned as error value.
D.2.3-Results
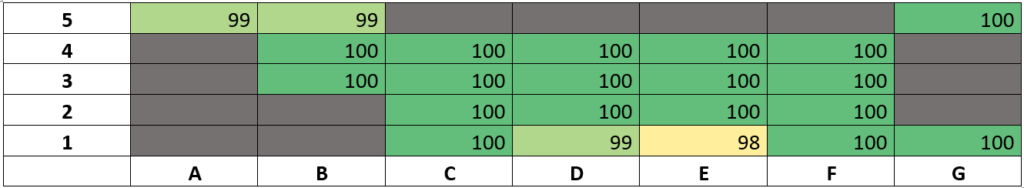
According to this test, for most the covered area, the position returned by the script is within the cell where the tag is actually placed with some exception.
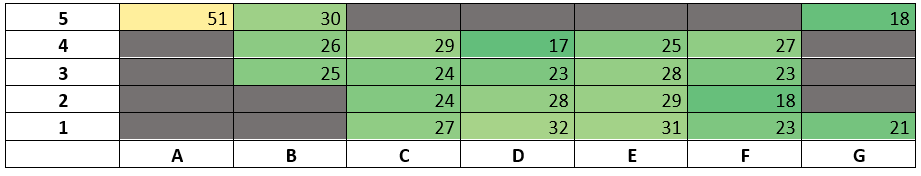
For most the covered area, the position error returned by the script is 30cm or less. The overall average error is around 26cm.
The noticeable behavior is that the position accuracy and repetitively degrade in proximity of the borders of the covered area, including the corners in direct proximity of an antenna.
Note : Greyed cells are locations where the tag tripod couldn’t be placed and no measurement have been performed.
D.3-Static height measurement accuracy
D.3.1-Measurements method
This method is similar to the horizontal measurement process. For each antenna, the elevation angles are averaged over a 1-second period. Using simple trigonometry, the height is then calculated from these angles. The final Z-axis measurement is obtained by averaging all the individual height calculations.
During this test the tag is placed at a height of 115cm.
D.3.2-Results
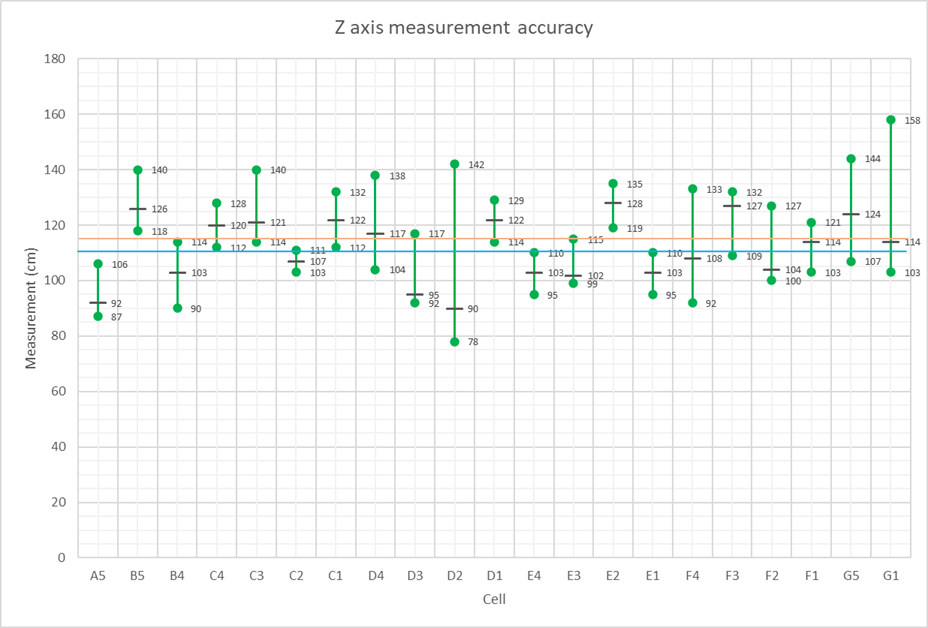
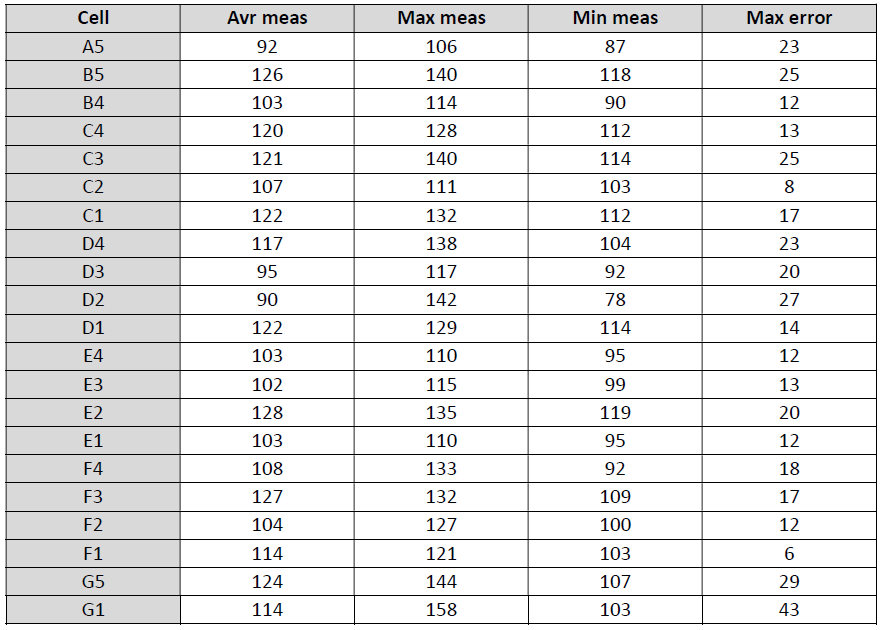
The height measurement presents a similar accuracy to the horizontal measurement with values mostly less than 30cm and with some exception.
Conclusions
- The ANT-B10 is no exception from the usual u-blox product design philosophy where time to market is a key target. As detailed along this article, the ANT-B10’s raw measurements can be integrated into a functional architecture using simple, cost-effective hardware and only a few lines of code. As a reference, this demonstration required approximately 4 engineering man-days for hardware and software development.
- The results are highly promising, achieving accuracy as precise as 30 cm. Although this test campaign is limited to static position measurements, it is safe to conclude that sub-meter accuracy is easily achievable, making AoA technology a go-to candidate for a wide range of indoor tracking scenarios
Disclaimer
Test results shown in this article are only indicative, tests were performed in uncontrolled environment, with uncalibrated equipment, repeatability is not guaranteed.
Une réponse à “U-blox Indoor positioning antenna ANT-B10 demo”
-
We are doing indoor positioning system with ublox antb10 antenna. We trying to design a adapter board to plug esp32 over the antenna. Can you pls share us the adapter design which is developed for your application, or atleast it’s exact dimensions.
Thank you.
We are doing indoor positioning system with ublox antb10 antenna. We trying to design a adapter board to plug esp32 over the antenna. Can you pls share us the adapter design which is developed for your application, or atleast it’s exact dimensions.
Thank you.